Author: Winterstein AG
Description
While the concept of confounding is broadly appreciated as a major threat to causal inference studies by epidemiologists and even non-epidemiologists, measurement or misclassification bias is less recognized. Likewise, while the value of randomization to ensure balanced comparison groups is intuitive, clinical trial features that address measurement bias may be more subtle. We understand that blinding may enhance objective assessments of outcomes by patients or clinicians, but other trial features are equally important including:
- protocol-based outcome ascertainment: This dictates what and how study outcomes are assessed, thus reducing the chance that outcomes are missed or mis-diagnosed.
- prescribed patient assessments at study entry: This ensures that key characteristics are captured to assess whether comparison groups are balanced with regard to baseline risk for the primary study endpoint and to define the level of generalizability of study results.
- monitoring of patient adherence to treatment assignments: This aims to prevent contaminated exposure groups where patients switch or discontinue treatment, thus diluting the observable treatment effect.
What does it look like in practice?
Clinical trials aim to impose a tightly controlled environment that includes prevention of measurement biases. RWE studies that rely on routinely collected data, in contrast, have no ability to prescribe what and how baseline conditions, exposures, and outcomes are collected. Thus, measurement in RWE studies (i.e., the process of converting the available data into key study variables) is as important as the choice of an appropriate study design. To illustrate, consider how information in electronic health record (EHR) or billing records is generated. Each step, from a patient’s decision to seek health care to a health care provider’s decision about how to evaluate the patient and what treatment to prescribe to a patient’s decision to use the prescribed treatment and seek follow-up care is not protocol based and is not random (see Figure 3.3).
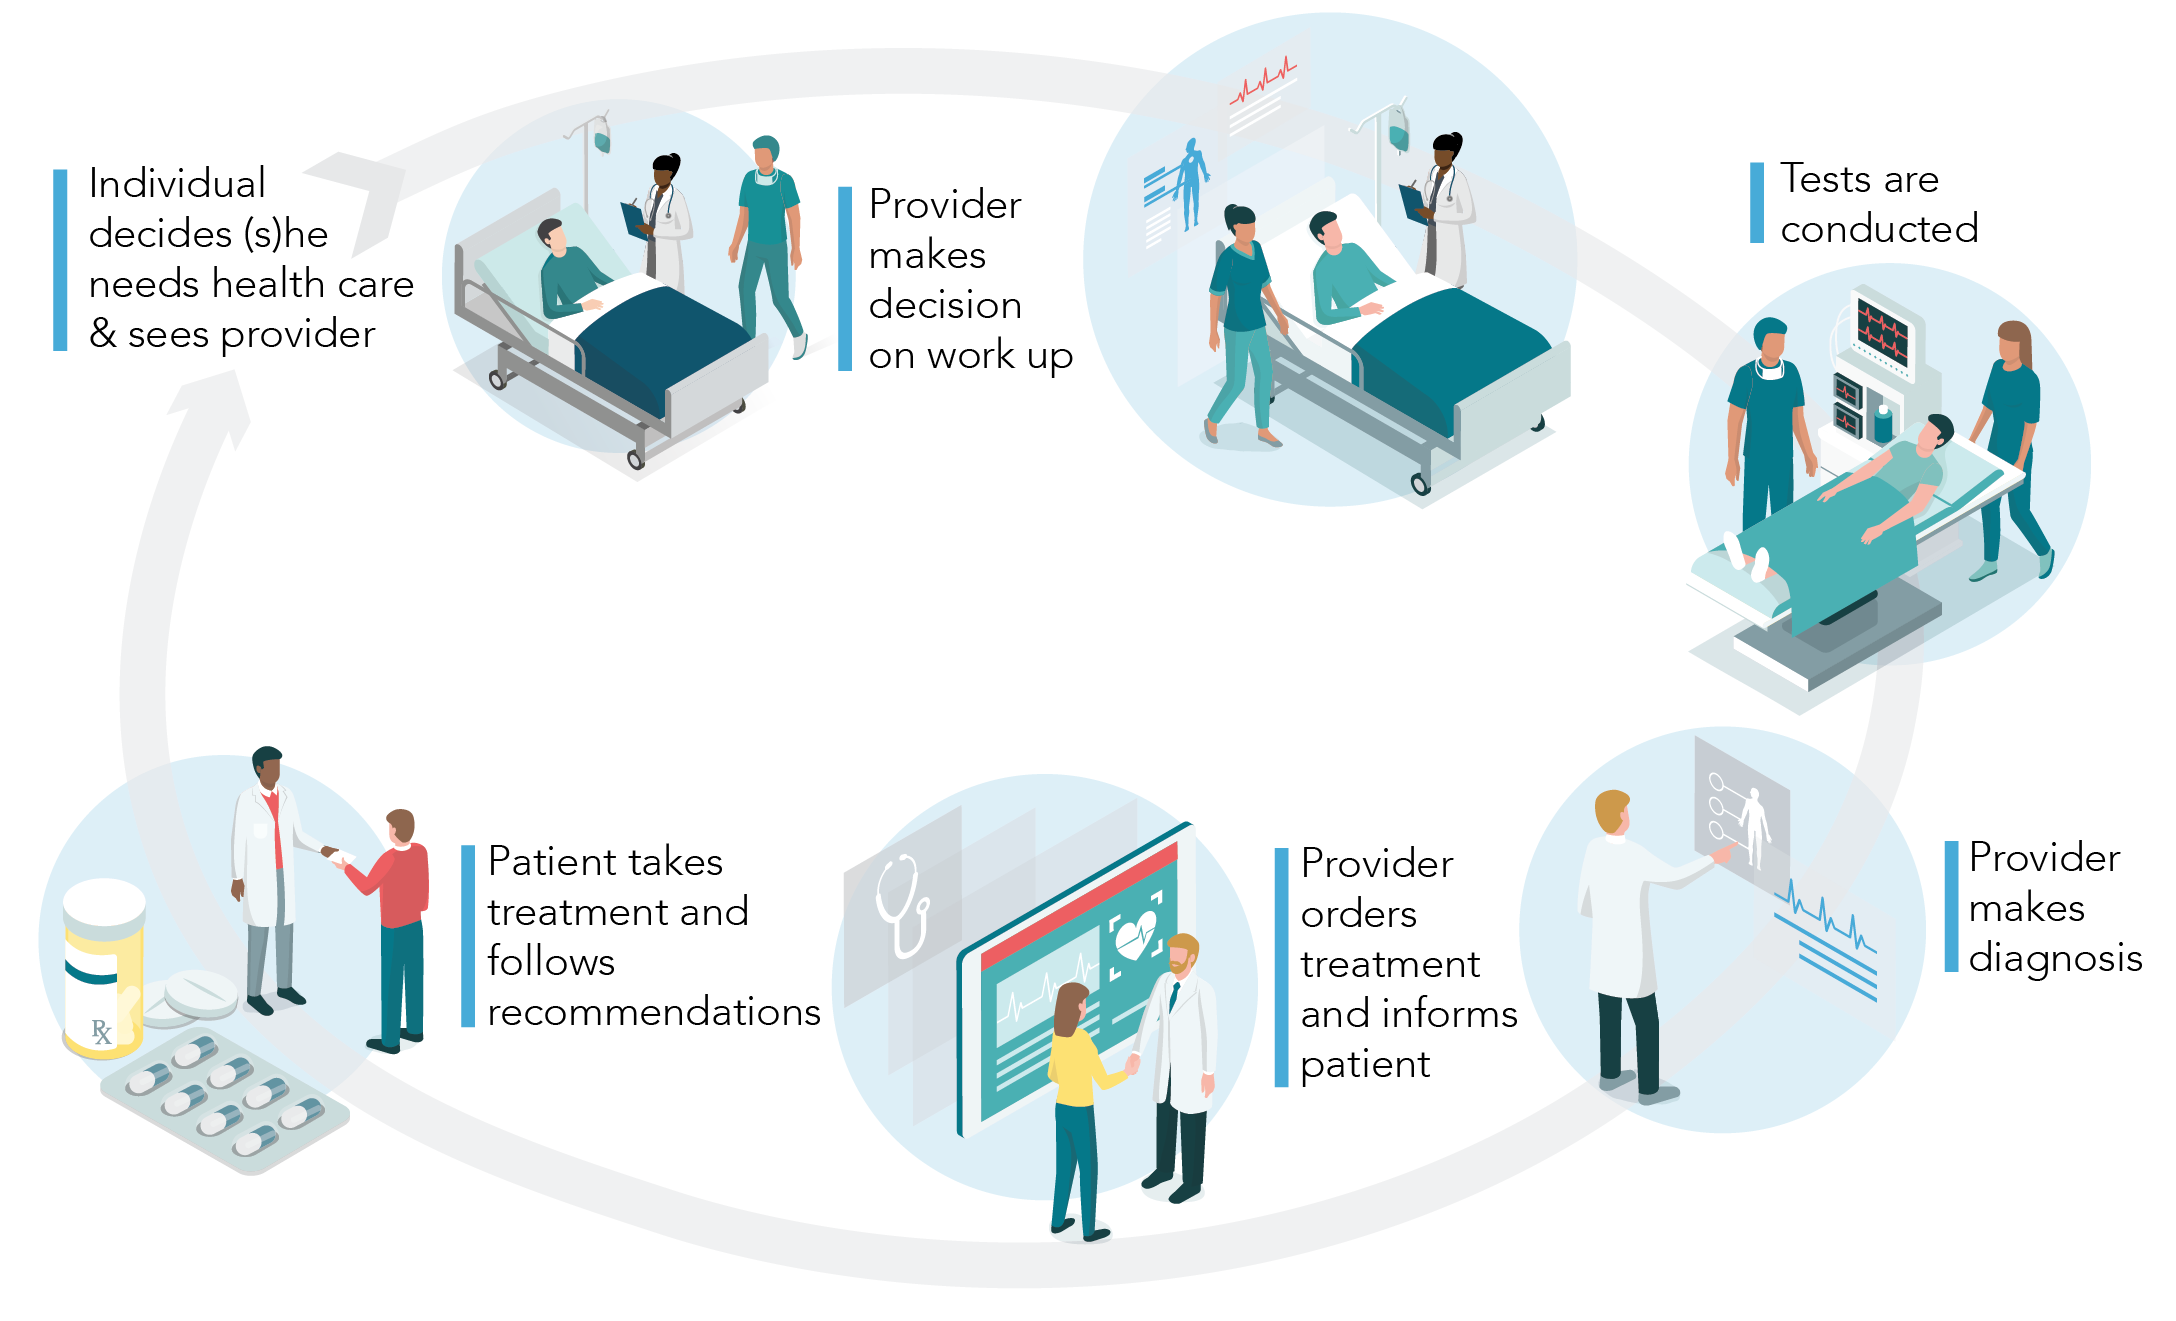
Figure 3.3. Patients who are available in a real-world data (RWD) database may be systematically different from the underlying population of patients we assume they represent. Diagnostic workups may be incomplete or flawed and result in incorrect clinical assessments. Patients may fill their prescription, but they may never consume the dispensed medication. Patients may have certain comorbidities that are not documented during a clinical visit or otherwise missed, leading to potential unmeasured confounders.46
In addition to this non-differential misclassification (i.e., error in measurement that affects both comparison groups to the same extent), researchers need to be aware of differential misclassification. For example, the propensity to get evaluated for a particular disease, leading eventually to its diagnosis, may be directly related to certain patient characteristics or their treatment. In this scenario, exposure groups will have a different probability for the detection of the outcome. Thus, for each exposure-outcome pair that is evaluated in a RWE study, it is critical to understand the process that generated the data (i.e., to understand what factors determine the validity of measurement).
Without understanding the process that generated the data (i.e., without understanding the health care system, patient and provider decision-making, and documentation and coding practices), we cannot show that:
- Patients who take medications to treat diabetes have more diagnoses of depression than patients who don’t (because patients with chronic medication use see their providers more often and have a higher probability of being evaluated for other diseases)
- Patients who take a newer brand of medication have better outcomes than those who take the older generic drug for the same indication (because socio-economic status is oftentimes not available in a database, affordability of the brand of medication becomes an unmeasured confounder)
- Patients who stop statins die sooner (because preventive medications are typically discontinued in end-of-life situations and patient prognosis may not be available in the database to address this issue of reverse causation)
- Patients who have regular refills of the prescription medication have less hospitalization than those who don’t (because hospitals usually don’t use patients’ home supply, hospitalized patients will have fewer refills)
None of these scenarios are causal. They rather reflect measurement biases, a different type of bias than confounding, which accordingly cannot be addressed with standard methods to adjust for confounding such as propensity scores.
Why is it a problem?
The above examples touch on scenarios where bias is introduced based on the sheer availability of data in the data set. To better understand the impact of such measurement biases, we can consider simple epidemiological 2x2 tables that describe differential or non-differential misclassification of binary outcomes, exposure, and confounders.47,48
Outcome misclassification
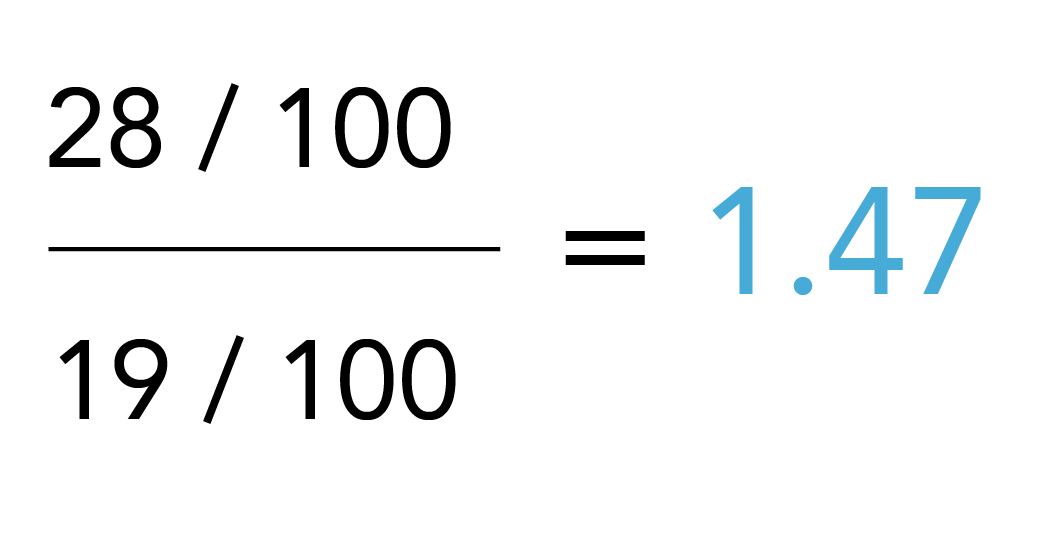
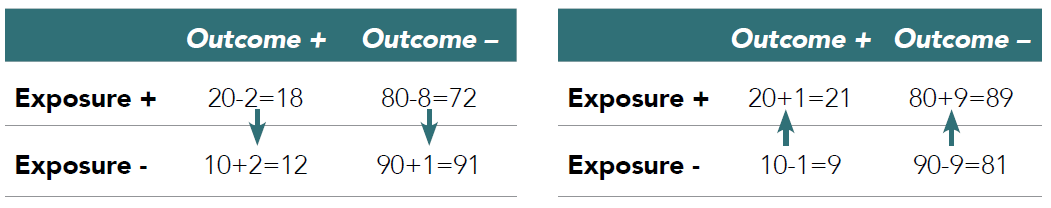
Outcome misclassification occurs if outcomes are missed (which signifies a sensitivity problem of the measure and is illustrated by the right-pointing arrows in Table 3.1) or outcomes are erroneously diagnosed (which signifies a specificity issue and is illustrated by left-pointing arrows).49 The examples in Table 3.1 show true values and the effect of non-differential misclassification of the outcome (i.e., similar measurement error in both exposure groups). The left scenario assumes 90% sensitivity (i.e., 10% of the true outcomes are missed) and the right scenario assumes 90% specificity (i.e., 10% of the patients without an outcome are misdiagnosed as having the outcome). The true risk ratio (i.e., assuming we are evaluating the results of cohort study and follow-up time is fixed) is calculated as:
|
Image
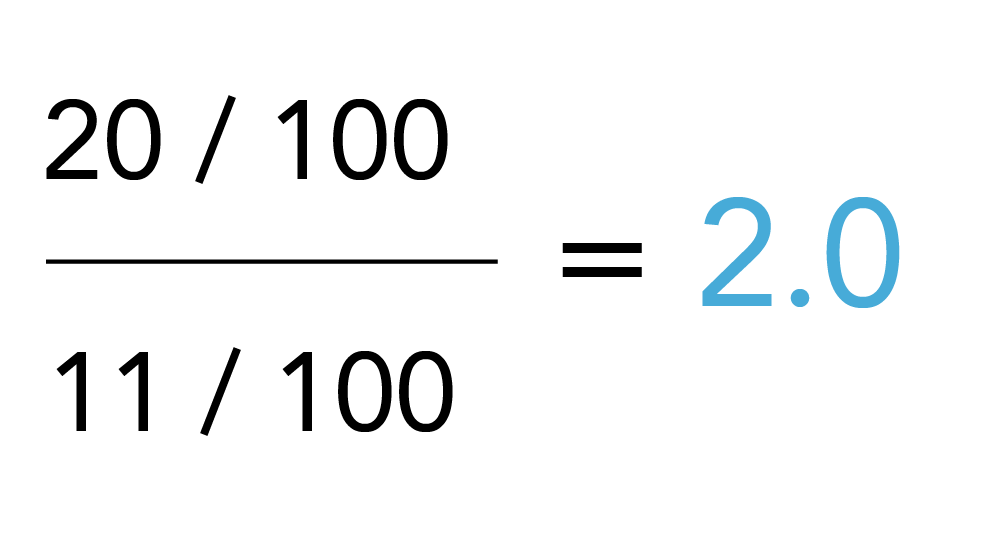 |
Table 3.1. Outcome misclassification
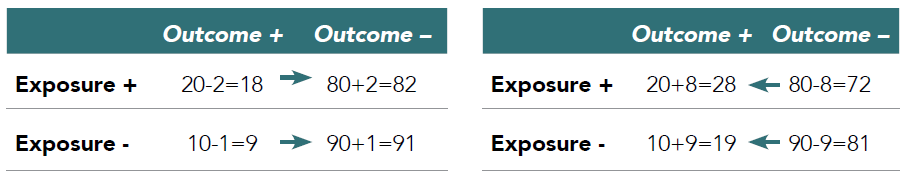
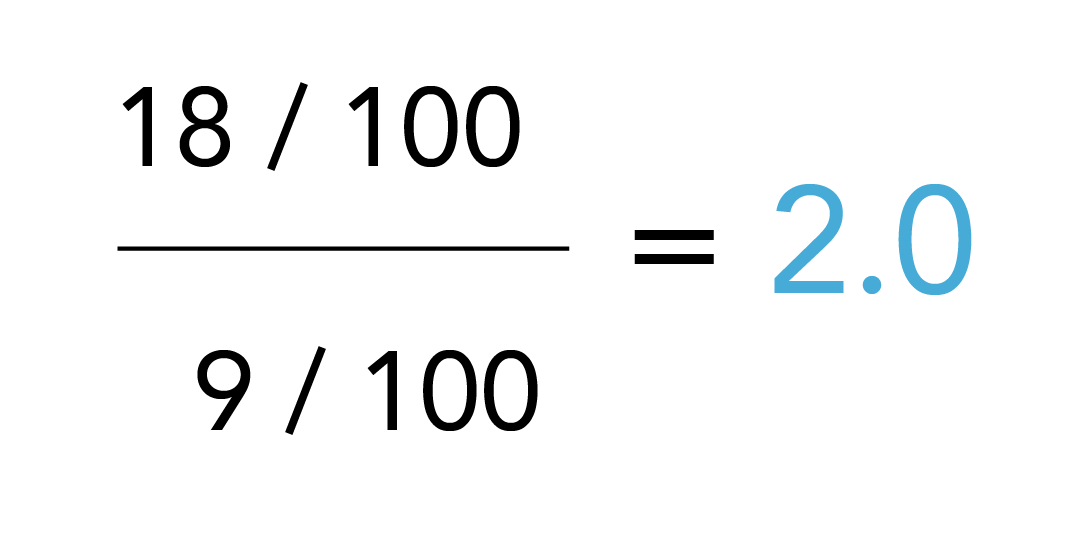
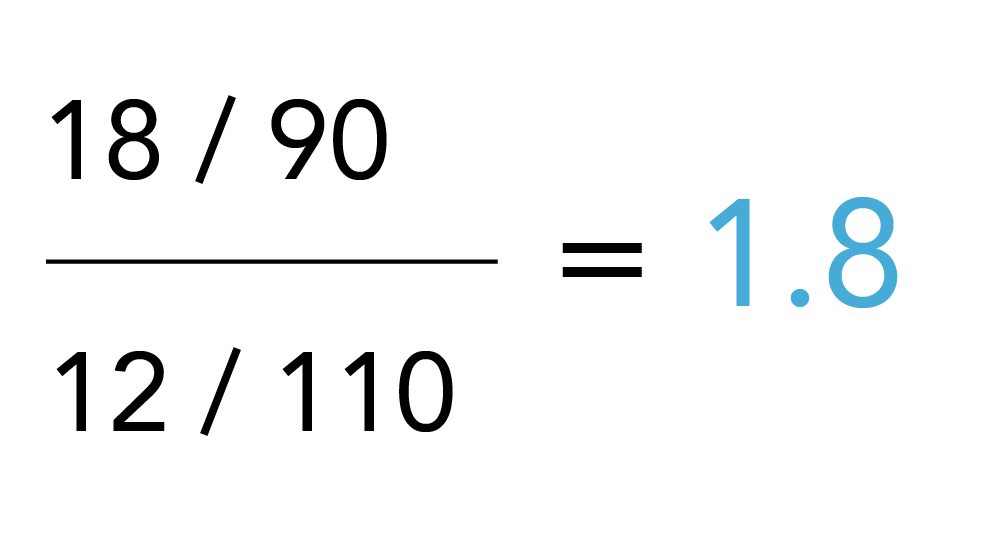
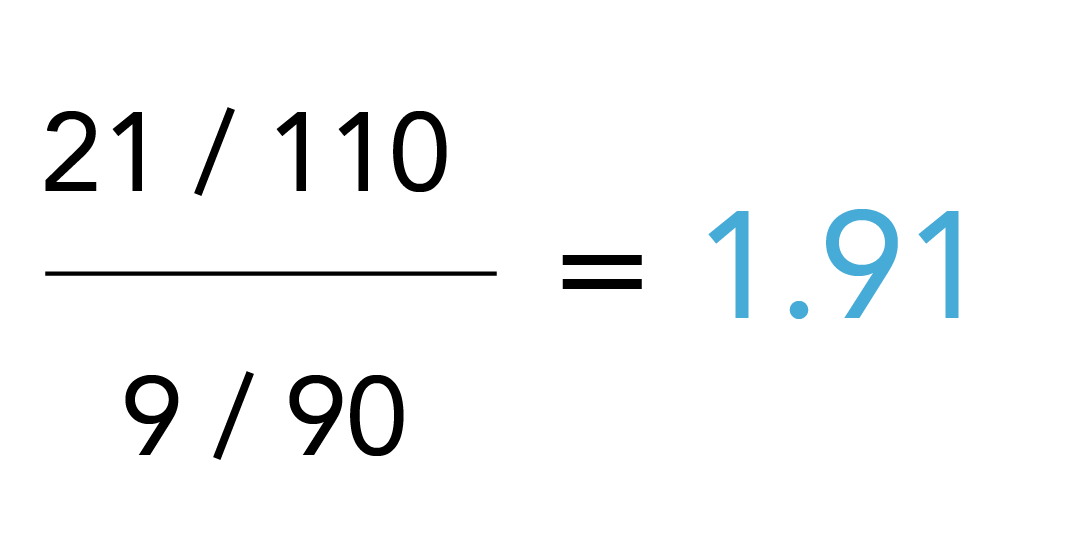
The observed risk ratio considering measurement bias is:
|
Image
 |
Image
 |
Thus, in this scenario (i.e., a cohort study with binary outcome classification), reduced sensitivity would not bias the risk ratio (note the same is not true for case-control studies and a variety of other scenarios of outcome misclassification where sensitivity does matter), but a reduced specificity biases the risk ratio towards the null hypothesis (no exposure effect).
Similar simple calculations can be conducted for scenarios with differential outcome misclassification, i.e., where sensitivity and / or specificity or both vary between exposure groups. It can be appreciated from the 2x2 tables that this will almost always result in bias.
Common issues with outcomes measured from routinely collected health care data arise when the diagnosis requires screening, such as with the manifestation of diabetes or testing for COVID-19, especially in populations that may remain asymptomatic. Screening procedures could be erroneously coded with the diagnosis, creating false positive cases and thus a specificity issue. Screening could also be omitted or delayed, creating false negative cases and a sensitivity problem. The latter is a typical scenario that can create differential misclassification inherent in systematic differences in clinical evaluations: for example, patients who use a drug that is known to cause diabetes (e.g., antipsychotics) will be more frequently evaluated for diabetes than a potential comparison group of non-users of antipsychotics.50 Likewise, in the pandemic we have observed enhanced screening efforts in high-risk groups such as health care workers, which will have likely biased population-based infection estimates. If the data for the exposure and comparison groups originates from different data sources, the risk for differential misclassification is often amplified and requires particularly careful assessment. To extend the COVID-19 example above, an investigation of the effect of vaccines on COVID-19 infections in real-world data would have likely shown a reduction of infections among vaccinated individuals early after vaccinations were accessible, even if the vaccine were in fact entirely ineffective. This is because the propensity to test for COVID-19 might have been reduced in anticipation of a protective effect of the vaccine. Of course, we have now learned that breakthrough infections may still occur, and accordingly, testing may have increased again.
As a general rule, outcomes that result inevitably in health care utilization because of their severity, such as hospitalizations, are typically less prone to misclassification errors than outcomes that require patient and clinician decisions for evaluation, but the ability of the database to capture and correctly classify any outcome should still be evaluated. For example, even though the diagnosis of myocardial infection is unlikely to depend on patients’ decisions to seek health care or clinicians’ decisions to order the appropriate tests, evaluation of myocardial infarction based on hospital admission records will be incomplete if death records are not accessible.
Exposure misclassification
Issues with exposure misclassification can be quantified using the same 2x2 tables. In Table 3.2, the left table illustrates again the effect of non-differential misclassification of exposure based on 90% sensitivity and the right table illustrates the effect of 90% specificity.
Table 3.2. Exposure misclassification
Note that the denominators, i.e., the total number of exposed and unexposed (initially 100 in each group), change as result of misclassification as well. Both scenarios bias the risk ratio and again, the contingency tables facilitate assessments of the impact of any other scenarios, e.g., where sensitivity and specificity problems occur simultaneously or where misclassification is differential, i.e., varies between those patients with and without outcome.
|
Image
 |
Image
 |
Specificity problems are prominent with exposure measurement in routinely collected health care data because of patient non-adherence issues and missing end dates in utilization (e.g., a prescription may have been written but not filled, or filled but not taken, or prematurely discontinued). Specific to COVID-19, the capture of vaccination data is a concern for exposure measurement as capture is fragmented and longitudinal data for the full dose series may not be available in a single database. This is especially difficult and more unusual than typical health care data because the setting varies from receiving a vaccine at the pharmacy to receiving the vaccine at a mass vaccination site such as a football stadium where reporting of the data may not be consistent or complete. Other challenging constellations include scenarios where the outcome follows soon after drug discontinuation or switching from one study drug to the other, where outcomes may have induction or latency periods or where drug effects continue after discontinuation.51 Understanding of the underlying pharmacology to guide assignment of exposure times, defined as the time period during which a drug effect could be expected, is critical to avoid misclassification and biased exposure effect estimates. A particular challenge is protopathic bias where drug exposure is discontinued because of early signs of outcome manifestation, which, if not considered in the design and measurement, will inevitably result in an underestimate of the drug effect.32
The effects of the pandemic on drug utilization are yet to be described, but one might expect greater gaps with drug refills due to reduced accessibility to health care providers in the outpatient setting. Problems in assignment of outcomes to distinct exposures might also occur in analysis of patients in acute or intensive care settings where different treatment approaches were tested empirically, leading to frequently changing regimen.
Confounder misclassification
While confounding and measurement bias are two separate mechanisms and require different approaches for mitigation, bias can occur in the measurement of confounders as well, potentially exaggerating the confounding bias. To calculate the impact of confounder misclassification, contingency tables can be used again, this time by stratifying by the confounder. Intuitively, it makes sense that a poorly measured confounder will result in poor adjustment for that confounder, but adjustment may not only be incomplete but may produce even more bias. Consider for example a scenario where a confounder is measured more completely (i.e., with better sensitivity) in the exposed than in the comparison group. This would create a false assessment of the presence of this confounder in the 2 comparison groups and thus, adjustment for this confounder would not balance the comparison groups but potentially amplify the imbalance. Related scenarios that can be encountered in RWD include more comprehensive assessments in the exposed than the comparison group (e.g., because certain tests are required before a drug is initiated). Another common clinical scenario is the documentation and coding of a disease during an office visit that presents the indication for a newly prescribed medication (e.g., obesity is coded if anti-obesity treatment is initiated, but omitted otherwise).
How to handle it
From the above it is clear that measurement bias can be introduced by any variable that factors into the final analysis of the (causal) effect of the exposure on the outcome. The impact of measurement bias can be severe and cannot be addressed with common approaches that are used to address confounding. In fact, in the case of misclassified confounders, adjustment for confounding may actually exaggerate bias. Such as with confounding, in order to anticipate measurement bias, it is critical to understand the process that generated the data and what factors have influenced whether a certain variable is present or not present in the data set or measured correctly or incorrectly. This includes an understanding of factors that influence patient decision-making, diagnostic processes and related coding practices, and reimbursement policies, to name a few.
No database will be optimal for the measurement of all necessary study variables with perfect validity, but careful review of each potential data source is the first step to avoid misclassification bias. It should be clear and accepted that every RWD researcher will encounter research questions that cannot be answered with the available RWD sources, and moving ahead and conducting such studies regardless is irresponsible. In those cases where we feel that measurement bias might be an issue but is addressable and does not preclude our ability to make valid causal inferences, there are several steps that can help in mitigating such bias.
Measure validation
Well-conducted pharmacoepidemiologic studies will aim to use measures that have been validated against a gold standard. This is commonly seen with claims-based outcomes measures that have been validated against medical charts, but to a much lesser extent with measures of exposure and confounders. The importance of metrics to operationalize validity (e.g., specificity or sensitivity) might vary based on the particular scenario that is addressed with the measure.52 It should also be noted that the suitability of a medical chart to serve as gold standard may vary across scenarios and thus, EHRs may need further evaluation against prospective protocol-based assessments, especially to ensure data completeness. Furthermore, validation studies should be generalizable to the data source, patient population, and other relevant factors that may affect the degree of measurement error that we would expect in the study at hand.
Simple bias / sensitivity analysis
The contingency tables above illustrate how the effect of misclassification errors on exposure effect estimates can be quantified. The same can be done post-hoc, after analyses have been completed to quantify the impact of potential measurement bias.53,54 Estimates of measurement error that can be tested may originate from validation studies (e.g., using published estimates of sensitivity or specificity) or be based on other assumptions such as expert opinion. Common examples for sensitivity analyses where the robustness of results across a range of values is tested include scenarios where the duration of assumed drug exposure is varied, or where look-back periods are increased to enhance the sensitivity of confounder measurement.
Probabilistic bias analysis
An extension of the contingency table approach is the use of probabilistic bias analyses, which can assess the impact of multiple measurement errors involving several study variables simultaneously. Using validation studies or other assumptions about the size of measurement errors, several study variables can be updated at the level of individual study participants and outcomes analyses redone with these new updated data sets.
Multiple imputation
As illustrated, measurement bias can occur because of incorrect or incomplete measurement (the topic of missing data is discussed further in the next section). The latter is often addressed with multiple imputation approaches that model the probability to have a potential variable (e.g., disease) or variable value of interest. As briefly touched upon earlier in this section, study variables in RWD are often not missing completely at random (MCAR) and thus, complete case analyses where patients with incomplete measures are excluded commonly introduce bias.55,56 Especially if there is reason to believe that absence of a variable does not reflect absence of disease (e.g., because of delayed diagnosis), multiple imputation might be an important means of completing missing data elements. Other approaches to addressing missing or incomplete variables, such as propensity score calibration and regression calibration, are based in similar approaches where richer information for a subset of patients is used to enhance the entire data set.57
In summary, even though a range of approaches to address measurement bias exist, they are not as widely integrated in RWE studies as approaches to adjust for confounding. This notwithstanding, measurement bias can be equally severe and greatly affect the ability to make causal inferences.58 Therefore, good pharmacoepidemiologic study practices require that potential sources of measurement bias are carefully examined, validation studies of key study variables are presented, and the direction of potential bias is addressed and ideally quantified.59 A well-conducted and presented RWE study will allow the assessment of whether the RWD source was appropriate (fit-for-purpose) for the research question at hand, and whether the processes that generated the data were appropriately considered in the study design and analysis.60,61